
How Business Dashboards Help Companies Make Faster Decisions
Business dashboards help companies turn scattered data into clear KPI reports, revenue analytics, operational insights, and real-time performance views so owners and managers can make faster, smarter decisions.
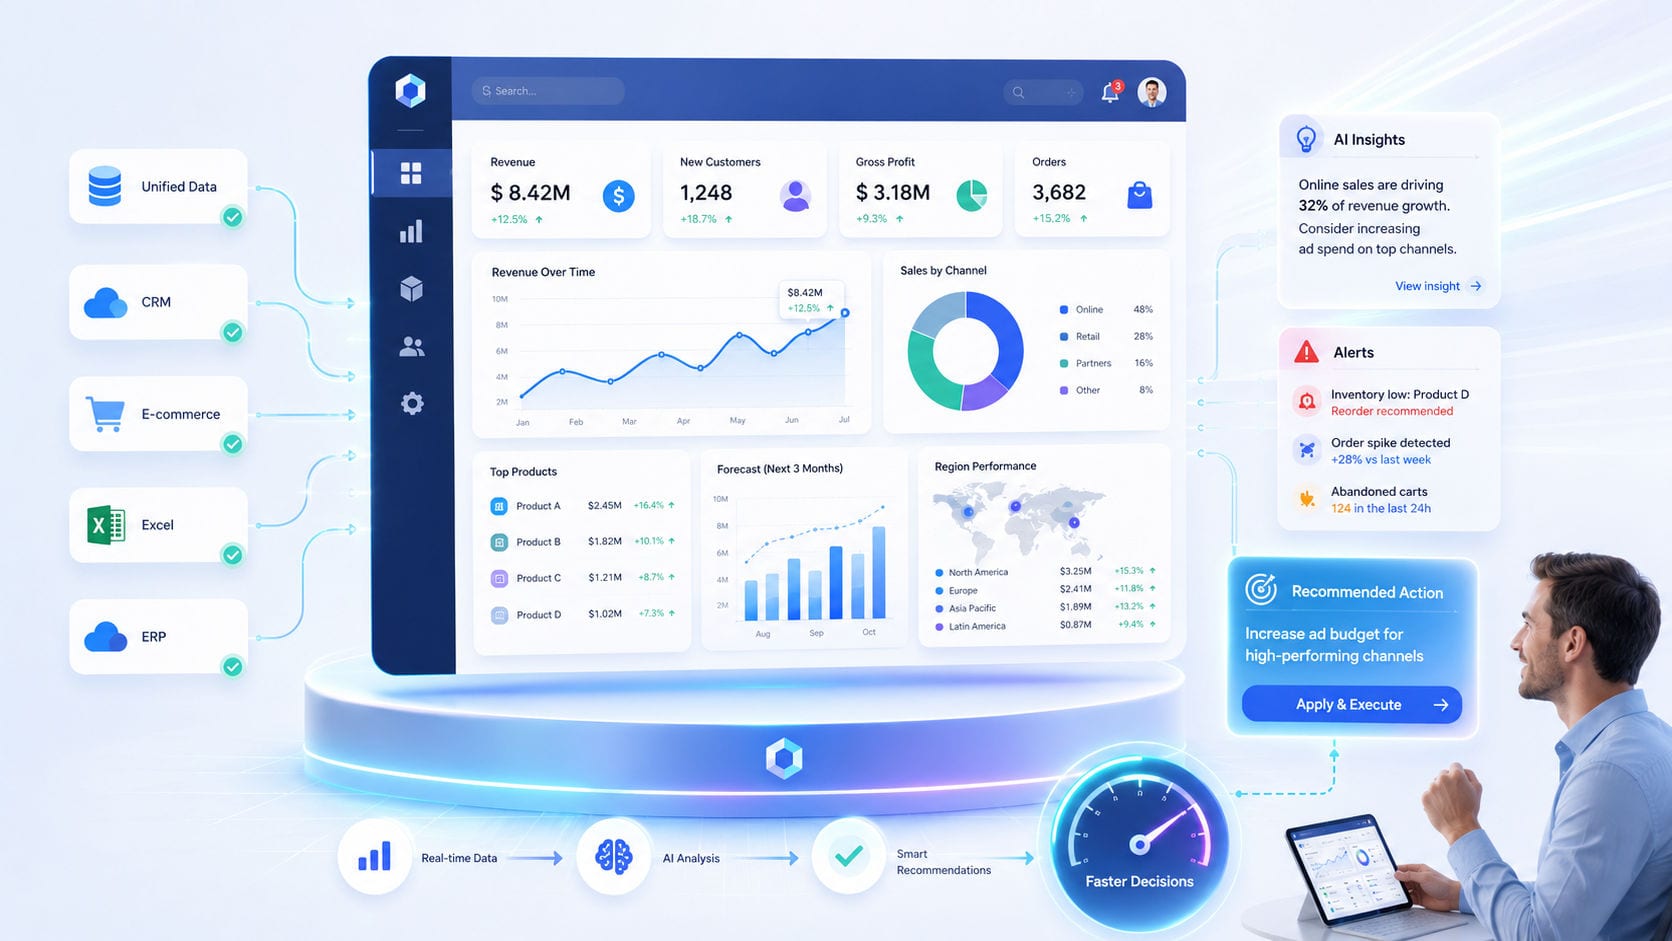
Modern organizations compile massive volumes of data daily, yet much of it remains underutilized. Sales metrics live in isolated spreadsheets, customer interactions reside inside CRMs, and payment records are tracked independently. When key metrics are scattered, leadership is left guessing. Making critical decisions becomes slow, reactive, and prone to error.
A business intelligence dashboard solves this challenge by consolidating disparate data pipelines into a single, intuitive visual interface.
Instead of waiting for weekly manual reports, owners and managers can access real-time operational visibility to drive proactive growth.
1. Defining Clear Success: Unified KPI Tracking
You cannot manage what you do not measure. A custom Key Performance Indicator (KPI) dashboard translates raw database tables into actionable, visual progress markers.
Revenue Analytics: Tracking sales growth, monthly recurring revenue, and customer lifetime value.
Operational Performance: Visualizing open support tickets, fulfillment queues, and process bottlenecks.
Marketing Conversions: Monitoring lead-acquisition costs and conversion ratios across campaigns.
See how we build custom reporting tools in Dashboard & Analytics Development.
2. Eliminating Spreadsheet Bloat: Automated Reporting
Preparing weekly reports manually is a massive sink of employee hours and frequently results in human input errors.
Automated Data Syncs: Fetching data from your CRM, billing software, and operations tools automatically.
Scheduled Digests: Mailing daily or weekly performance summaries directly to key stakeholders.
Single Source of Truth: Ensuring the entire leadership team references the exact same metrics during strategy meetings.
3. Optimizing Sales Pipelines & Revenue Trends
Sales dashboards help B2B organizations monitor the health of their sales funnels and react immediately to market changes.
Pipeline Value: Tracking the total potential revenue of active, qualified opportunities.
Sales Velocity: Measuring how fast a lead moves from initial contact to a signed contract.
Win/Loss Analysis: Identifying why deals stall or fall through to adjust sales strategies.
4. Uncovering Bottlenecks: Operations Dashboards
Operational visibility is key to maintaining quality control. Dashboards allow operations managers to oversee workflows as they execute.
Workload Balancing: Seeing which staff members have pending approvals or heavy task queues.
SLA Compliance: Flagging customer service tickets or bookings that are nearing their deadline.
Cycle Times: Measuring the average time it takes to complete a business process from start to finish.
5. Real-Time Analytics for Dynamic Industries
For transaction-heavy businesses (such as e-commerce, SaaS, logistics, and travel), waiting days for a report is not an option. Live dashboards show you what is happening right now.
Live Inventory: Visualizing stock levels, pending shipments, and warehouse queues.
Active User Sessions: Monitoring SaaS platform usage, checkout completions, and payment gateway health.
Instant Notifications: Alerting support leads when customer wait-times exceed thresholds.
The Advantage of Custom Dashboard Development
Generic SaaS reporting tools are often rigid, forcing you to adjust your business processes to match their template widgets. A custom dashboard is designed around your exact business goals.
By engineering a tailored dashboard, we connect directly to your proprietary databases and API infrastructure, displaying only the metrics that drive your business forward.
Want to build a custom business dashboard to unify your company's data? Let’s design your dashboard blueprint through our Guided Discovery Intake or consult our engineering team at Motive Solutions Contact.